Table of Contents
Where can I create my phishing reports?
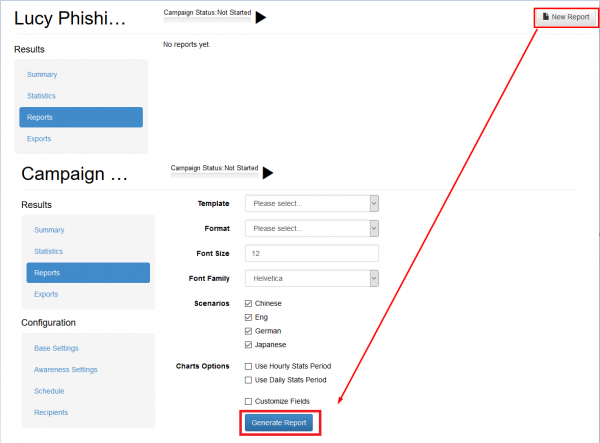
Within each campaign you will find a button that allows you to create a PDF, HTML, Word (docx) or raw CSV report based on a predefined template.
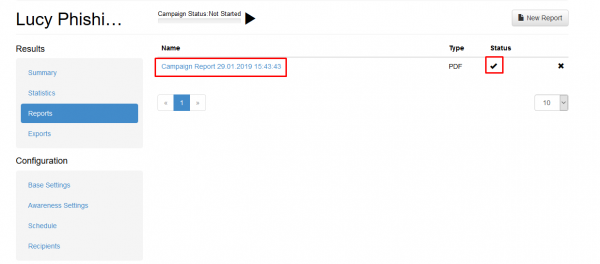
Once the report is created (please be patient - the report creation may take a few minutes) the status indicates that it is available for download (just click on the date/time to start the download):
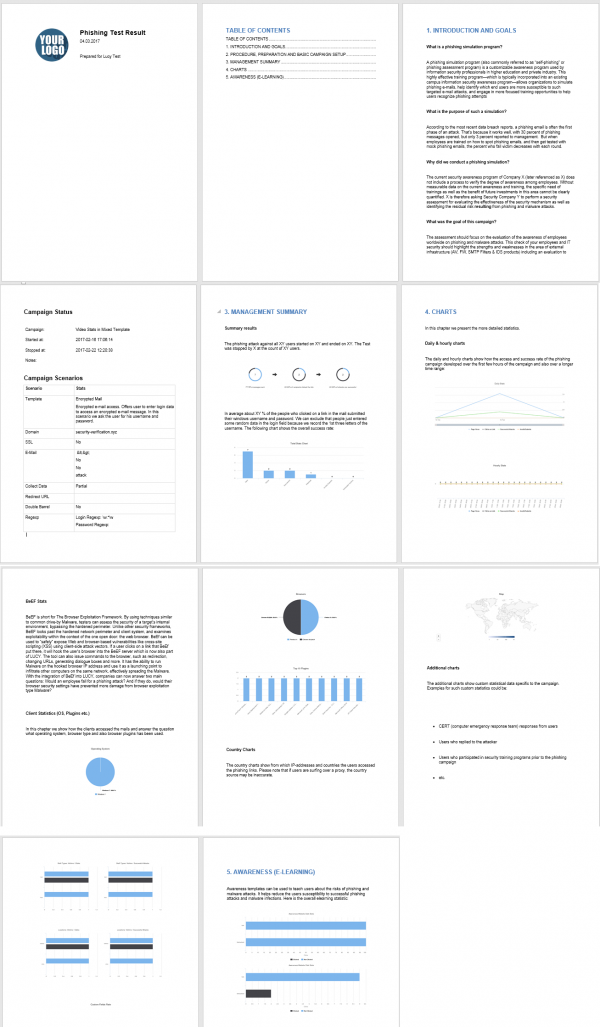
Below is an output of a LUCY sample report using the .docx template (please note that the recipient details are not included; this is a different template):
Where can I find my report templates?
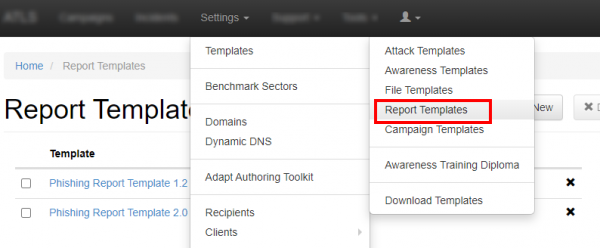
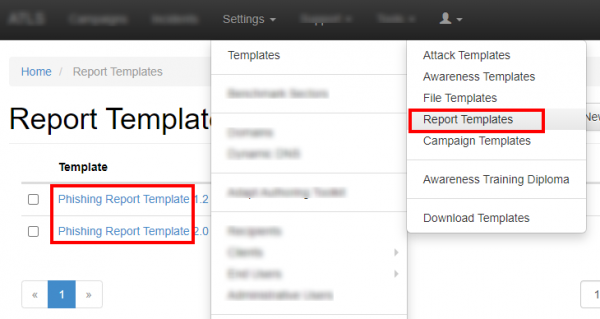
LUCY comes with one predefined report template called "Phishing Report Template". You find it under "Settings/Templates/Report-Templates".
How can I edit my report templates?
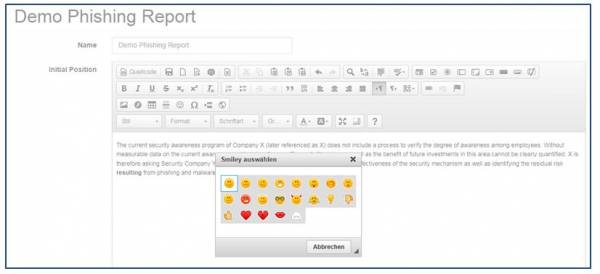
You may either edit the existing template or create a new one. The template contains sections which can be freely edited. These sections can be used later in PDF, HTML or Word reports which are generated within a campaign.
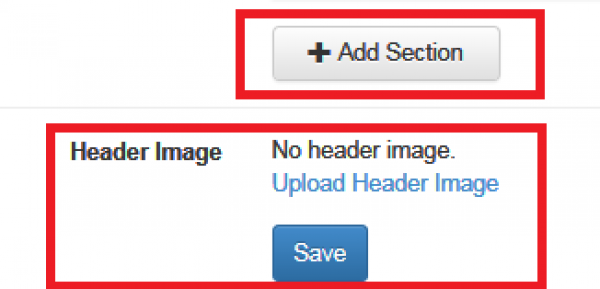
You may add your own sections and also customize the title name and logo.
What variables can be used for the report?
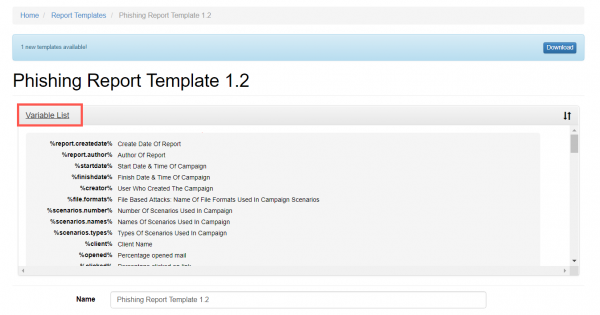
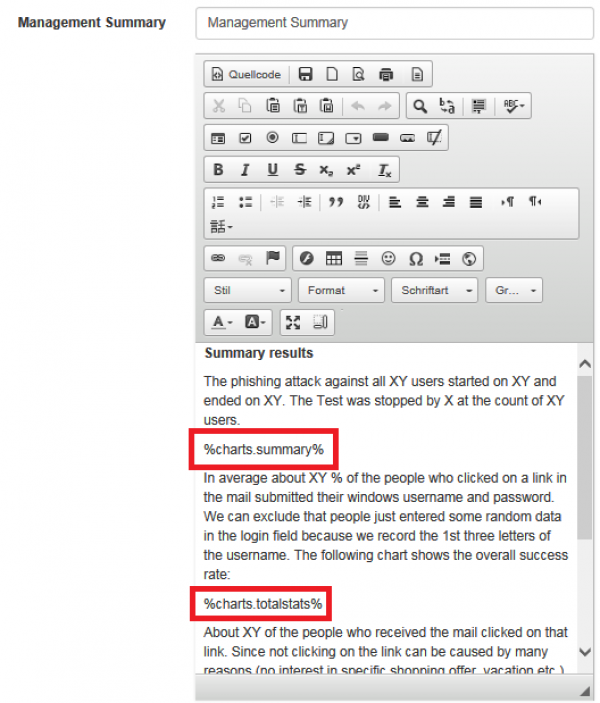
Lucy comes with a constantly growing list of variables which are placeholders for specific statistics or graphics. You find the variables within the variable list in LUCY:
Those placeholders can be inserted in the content of any report chapter:
When you create the report within a campaign those variables will be populated with your specific campaign statistics (similar to the graphics you already know from the dashboard). Those variables are:
- %report.createdate% Create Date Of Report
- %report.author% Author Of Report
- %startdate% Start Date & Time Of Campaign
- %finishdate% Finish Date & Time Of Campaign
- %creator% User Who Created The Campaign
- %file.formats% File Based Attacks: Name Of File Formats Used In Campaign Scenarios
- %scenarios.number% Number Of Scenarios Used In Campaign
- %scenarios.names% Names Of Scenarios Used In Campaign
- %scenarios.types% Types Of Scenarios Used In Campaign
- %client% Client Name
- %opened% Percentage Of Opened Mail
- %opened.count% Number Of Emails Opened
- %clicked% Percentage Clicked On Link
- %clicked.count% Number Of Emails Clicked
- %sent.count% Number Of Emails Sent
- %reported% Percentage Of Users Reported
- %success% Percentage Of Emails Submitted Data
- %success.count% Number of Emails Submitted Data
- %domains% Domain(s) Used In Scenario Settings
- %timezone% Timezone Setting Of LUCY
- %recipients.groups% Recipient Group Names In Campaign
- %awareness.names% Name Of Awareness Template Used
- %awareness.sent% Number Of Awareness Emails Sent
- %awareness.opened% Number Of Awareness Emails Opened
- %awareness.incomplete% Number Of Users With Incomplete Training
- %awareness.completed% Number Of Users Who Completed Training
- %questions.number% Number Of Questions In Quiz
- %data.number% Absolute Number & Relative Number Of Collected Data From Users
- %out.of.office% Percentage 'Out Of Office' Responses
- %bounced% Percentage Bounced Messages
- %responded% Percentage Responded Recipients
- %recipient.count% Number of recipients
- %incident.count.campaign% Number of incident reports in campaign
- %incident.count.campaignrelated% Number of all campaign-related reports in total
- %incident.count.notcampaignrelated% Number of all reports not related to campaigns
- %incident.count.total% Number of incident reports total
- %logo% Logo
- %table.contents% Table Of Contents
- %system.info% System Information
- %file.settings% File Based Attacks: Settings Table
- %scenarios.settings% Scenarios Settings
- %scenarios.filebased.settings% Filebased Scenarios Settings
- %message.settings% Message Template Settings
- %schedulers% Scheduler Settings
- %awareness.settings% Awareness Website Settings
- %data% Reports the file attack output & forms POST data
- %additional.fields% List Of Available Recipient Fields
- %victim.table% Detailed Victim Results
- %victim.table.opened% The list of victims who opened the email
- %victim.emails% Table of recipient email addresses
- %victim.table.osbrowsers% Browser and OS stats table
- %victim.table.trainingstats% Table With Columns: "Email", "Trained", "Trained At", "Answers Count", "Correct Answers", "% Of Correct Answers"
- %victim.table.successclickrate% Table Columns: "Email", "Succeeded", "Succeeded At", "Success Rate", "Click Rate"
- %victim.table.mailstats% Table Columns: "Email", "Email Opened", "Mail Submitted At", "Clicked", "Clicked At"
- %quiz% Quiz Questions
- %analyse.stats% Analyse Statistics
- %benchmark.stats% Benchmark Statistics
- %compare.stats% Campaign Comparison Statistics
- %trends.stats% Trends Stats
- %timeline% Campaign Timeline
- %scenarios.table.successaction% Scenarios Success Action Table
- %charts% All Charts
- %charts.summary% Summary Chart
- %charts.totalstats% Total Stats Chart
- %charts.analyse% Analyse Stats Chart
- %charts.awarenesstime% Awareness Time Chart
- %charts.scenariotime% Scenario Time Chart
- %charts.scenariostats% Scenario Stats Chart
- %charts.dailystats% Daily Stats Chart
- %charts.hourlystats% Hourly Stats Chart
- %charts.responses% Responses Detection Chart
- %charts.events% Events Chart
- %charts.os% Operating System Chart
- %charts.browsers% Browsers Chart
- %charts.files% Files Chart
- %charts.plugins% Plugins Chart
- %charts.countries% Countries Chart
- %charts.awareness% Awareness Stats Chart
- %charts.clickstats% Click in First 8 Hours Chart
- %charts.awarenessclicks% Awareness Website Clicks Chart
- %charts.additional% Additional Charts
- %charts.custom% Custom Fields Charts
- %charts.stafftype% Staff Types Chart
- %charts.location% Locations Chart
- %charts.division% Divisions Chart
- %charts.comment% Comments Chart
- %charts.reports% Percentage reported/not-reported Chart
- %charts.reportdynamics% Reports Dynamics Over Time
- %charts.quizquestions% Awareness Quiz Questions Chart
- %charts.quizscores% Awareness Quiz Scores Chart
- %charts.quiztimes% Awareness Quiz Times Chart
- %domains.table% Domain list (table with columns: "Domain", "Associated scenario")
- %users.table% Campaign responsible users (table with columns: "User", "User type")
- %recipient.group.table% Recipient groups (table with columns: "Group", "Number of users in this group")
- %recipient.group.extendedtable% Recipient group to scenario association (table with columns: "Name", "Scenario", "Mapping", "Recipients")
- %recipient.group.customfields.table% Recipient settings (table with columns: “Group Name“, “Fields”, “Values”)
- %campaign.scenarios.table% Table of scenarios for the campaign (table with columns: "Scenario Name", "Scenario Type")
- %awareness.website% All Awareness Website Screenshots
- %awareness.website.table% All Awareness Website Screenshots Table
- %awareness.mail% All Awareness Email Template Screenshots
- %message.screen% All Message Template Screenshots
- %landing.screen% All Landing Page Screenshots
- %landing.screen.table% All Landing Page Screenshots Table
- %message.screen#% Message Template Screenshot (# - replace to scenario sequence number)
- %landing.screen#% Landing Page Screenshot (# - replace to scenario sequence number)
- %summary% Summary report across all campaigns for the current client
- %summary.[type]% Summary report across all campaigns by scenario type ([type] - scenario type, example: %summary.file%). List of available scenario types:%summary.file% - File-Based
- %summary.mixed% - Mixed
- %summary.malware_test% - Technical Malware Test
- %summary.hyperlink% - Hyperlink
- %summary.data% - Web Based
- %summary.awareness% - Awareness Only
- %summary.usb_attack% - Portable Media Attack
- %summary.mail_web_test% - Mail & Web Test
- %summary.[period]% Summary report across all campaigns by time ([period] - time period in years or months, example: %summary.2016-2017% or %summary.11.17-12.17%)
- %worst.employees.[limit]% Worst employees ([limit] - number of entries to show, example: %worst.employees.10%)
- %worst.division.[limit]% Worst divisions ([limit] - number of entries to show, example: %worst.division.10%)
- %worst.location.[limit]% Worst locations ([limit] - number of entries to show, example: %worst.location.10%)
- %worst.staff_type.[limit]% Worst staff types ([limit] - number of entries to show, example: %worst.staff_type.10%)
- %worst.comment.[limit]% Worst comments ([limit] - number of entries to show, example: %worst.comment.10%)
You can see the result of using each of the above variables here.
Can I add custom parameters to my report?
Yes - with LUCY > 3.1 you can add custom parameters to your report.
How can I create raw CSV exports of my campaign data?
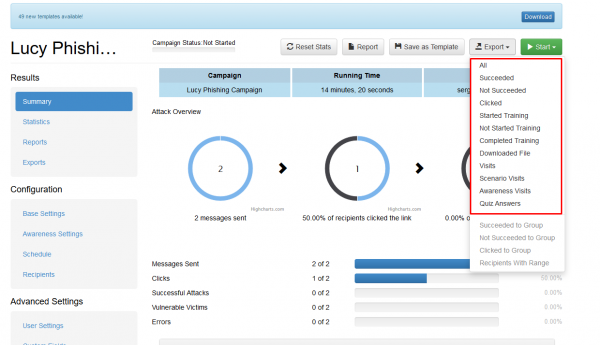
If you click on a campaign name you will be able to export all data to a raw CVS export:
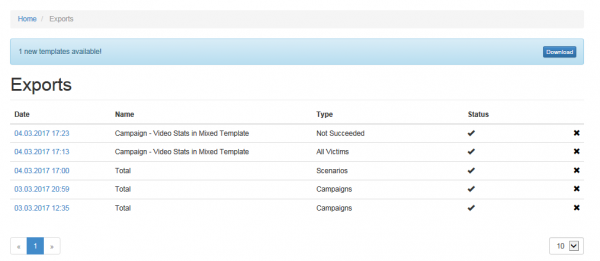
The export then can be downloaded under support/exports:

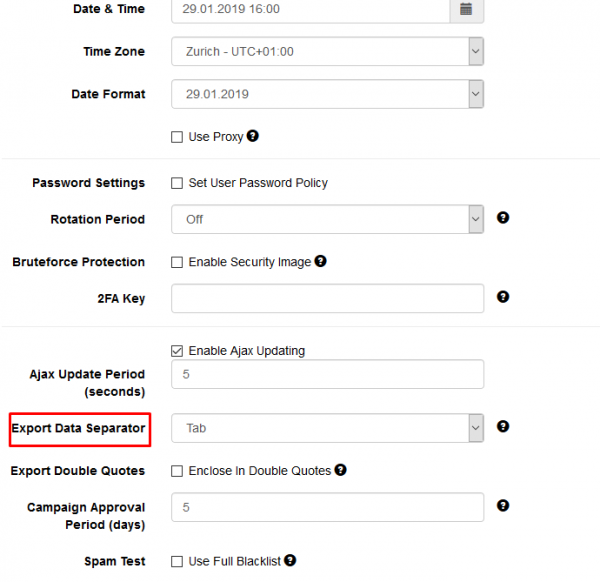
You can change the default separator in the Advanced Settings section:
Is it possible to automatically export report data?
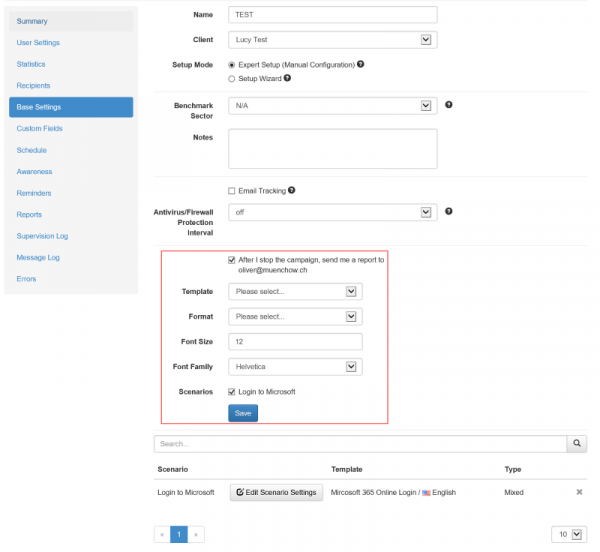
You can have LUCY automatically create a report and send it to the email address associated with the user that created the campaign by clicking on the checkbox "After I stop the campaign, send me a report to…".
As soon as you stop the campaign the report will be mailed to that address:
Is it possible to automatically pull report data from LUCY (e.g. from your SOC)?
You can fetch all campaign statistics by using our REST API.
